If you use general ledger, budgeting, or cashflow forecast in Dynamics 365 Finance (D365F), then you may also need to utilize the “Financial reports” functionality. Balance sheet, income statement, cash flow – all of them can be prepared by using this financial reporting tool. In this blog post, I explain the options you have in setting up and querying financial data by using the financial reporting feature in D365F.
Besides this article, I also recorded videos about the financial reporting function. If you are new to reporting setup in D365F, please have a look at them. These videos give you a quick overview about the feature:
Financial reporting functionality allows you to generate reports based on the general ledger, cashflow forecast, and budgeting data. Keep reading to find out how to get financial data from those sources.
Contents
- Basic components
- Concept idea
- Querying the ledger
- Other sources for reporting
- Drill-down functionality
- Override a column definition
- Other options to query and filter
- Options to generate reports
Basic components
Financial reporting page
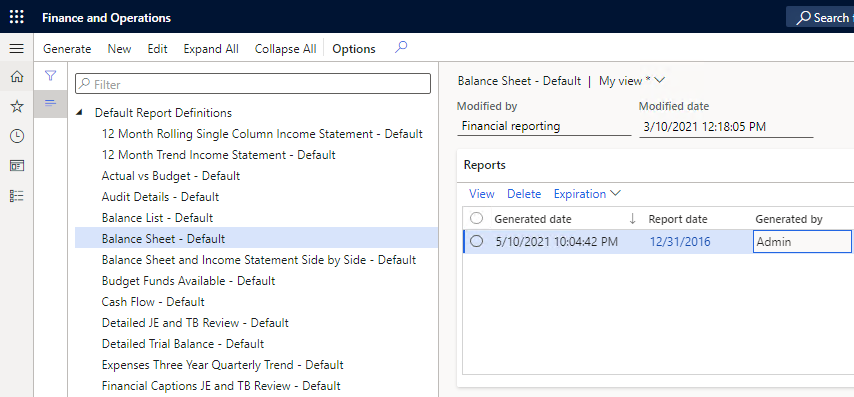
All financial reports can be found on the “Financial reports” page in the web interface of D365F.
Report designer
The report designer is used to design the reports you need. The report designer is a ClickOnce application.
To create a new report or edit an available one, you need just click the New or Edit button on the “Financial reports” (General ledger > Inquiries and reports) page. After that, the system launches the report designer.
To launch the report designer from Chrome, you may need an extension. To launch the application from the Edger, you may need to turn on the “ClickOnce Support” flag (edge://flags/). To get information about troubleshooting the report designer issues please follow this link.
The system is shipped with the default reports. These reports are great examples to start from for using the feature. To import the default reports into the system, you need to use the “Tools / Import Default Reports” item in the report designer. The default reports are described here.
The report designer has a few definition areas where you set up how the report will be generated.
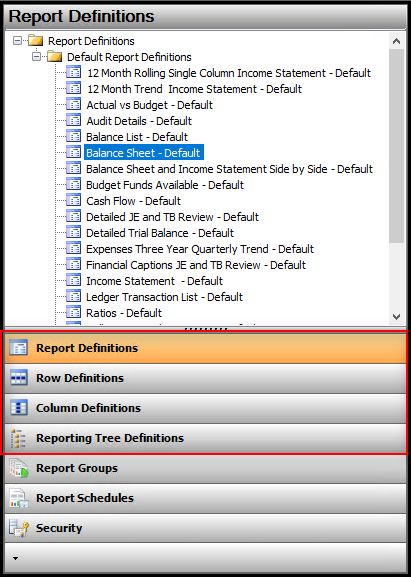
In a common scenario, you setup the report row definition, where you define all rows needed in the report. After that, you configure the column definition. Next, you set up the report definition. The definitions are known as the “building blocks” of the report.
Manage building blocks
Besides the left definitions area, you also have an option to search all available building blocks. This option is available in the “Open” form by following the “File / Open…” menu item.
You can also copy a building block by the “Save as” function. This option is useful when you need to create a new building block based on an already available one. This function is available in the “Open” form, which can be reached by following the “File / Save As …” menu item.
The system has options to export/import building blocks. It can be useful when you set the report in the test environment, and then need to transfer the building blocks to the production. The option is available in the “Building Block Groups” form, within the “Company / Building Block Groups” menu item. The documentation is here.
Cache and data mart
When you set up the financial reporting you may face some issues related to the data you see in the report designer or financial reports. This section describes two technical aspects related to the data sources in financial reporting which can help you to figure out what went wrong.
It is good to know that the report designer caches some data shown in the user interfaces, such as accounts, periods, etc. This can help if you encounter any issues. For example, if you add an account in D365F and you cannot find it in the report designer list of accounts, you can refresh the cached financial data to resolve the issue. This function is available under the “Tools” menu.
You may face an issue when you run the financial report and see that the numbers are not reported as you expect. The issue can be related to the financial reporting data mart.
The data mart is a special database which holds the necessary data for financial reporting. The financial data is automatically moved from the D365F database to the financial reporting data mart. In some circumstances, the data in the D365F database and the data mart can be out of sync. It can happen, for example, when you restore the D365F database from a backup.
Data mart resetting can be an option to fix the issue. Resetting can be a time-consuming operation when the D365F database has a lot of data. Before resetting the data mart, it is a good idea to learn the cases when the reset is necessary and when it is unhelpful. The documentation is here.
Instructions on how to reset the data mart is described here.
Concept idea
In a typical scenario, you start to configure the report by defining the rows of the report in the row definition form. Each row must have at least the description and the financial dimensions defined. The financial dimension may be considered as the ledger account, ledger account category, or financial dimension value. The financial dimensions are used to query data, which is necessary for the row.
Then you define the columns of your report in the column definition form. You need the column to show the row description, and the columns to show exact amounts. For the columns where the amounts will be shown, you need to set the period parameters.
The important thing to remember is the following: in a typical scenario, the system queries the transactions by financial dimension values specified in the row, and for the period defined in the column.
Report designer default company
The financial data and settings are separated by legal entities in D365F. The legal entity in the web interface of D365F refers to the company in the report designer. When you use the financial reporting, you need to pay attention which company is used to query the data.
When you set up the financial report, you usually deal with the chart of accounts. The chart of accounts is linked to the legal entity in D365F. It means that you may need to define an appropriate company in the report designer to query the chart of accounts you need.
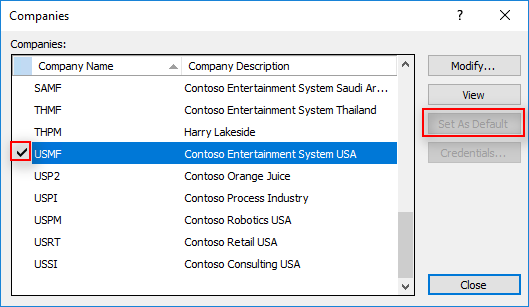
To set the default company in the report designer, you need to navigate to the “Company” form by the “Company / Companies…” menu, then select the company (legal entity) you need and click on the “Set As Default” button.
The link of the legal entity and the chart of accounts is specified on the “Ledger” (General ledger > Ledger setup) page in D365F.
Querying data of the company
D365F stores the transactions for the exact legal entity. You need to pay attention which company you are using when you generate the report.
There are at least four places in the system where you can specify the legal entity:
- default company in the report designer
- the report definition form
- the tree definition form (out of scope of this article)
- selection of the active legal entity in the D365F web interface.
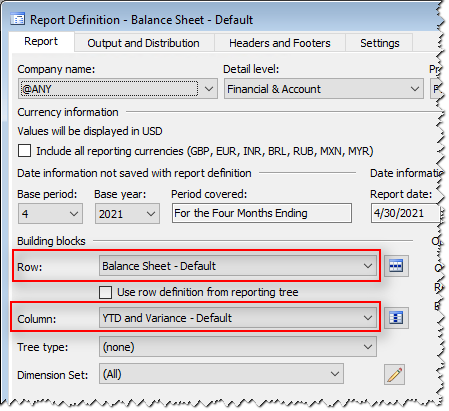
When you generate the report from the report designer (more about this is here) and the company in the report definition is set to the “@ANY” value, then the data is fetched from the company that is set as the default in the report designer. The same is true when you generate the report from the D365F web interface – the system queries the data for the active legal entity of the page.
It the specific is specified in the “Company name” field in the report definition, then the system queries the data for the specified company; the report designer default company is not considered. The same is true for the active legal entity on the D365F page.
When the company is specified in the report definition, you need to be careful when you generate the report in the web interface. If the active legal entity of the page is different from the specified company in the report definition, then the generated report will not be shown on the page. You will see the generated report when you switch the active legal entity to match the company in the report definition.
Options to generate the report are described here.
Querying the ledger
The financial reporting allows to query data from the ledger. The source of information is voucher transactions.
The information provided in this section is also applicable for other sources for reporting.
Row definition
When you configure the report, it is necessary to define report rows in the “Row definition” form. To define a row, you need to set up at least the following parameters.
Row Code and Description
- Row code – the code of the row. This code can be referenced when you need to calculate the value based on other rows. The system automatically numbers the rows. There is also an option to renumber. This option is available under the top menu “Edit / Renumber rows…” in the report designer. More about the row codes can be found here.
- Description – the description of the row. For example, in case of the balance sheet report, the row descriptions can be Cash, Inventory, Accounts Receivable, etc. More about the row description is here.
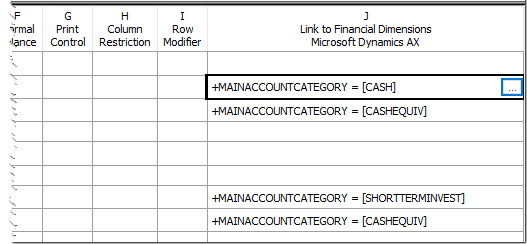
Link to Financial Dimension
You also need to specify the “Link to Financial Dimension” parameter. This parameter is used to define filters to calculate the column values for the row. The filters are only related to the ledger accounts, account categories, and financial dimension values. More is here.
The report designer provides a few tools to set up the link to financial dimension. When you double-click on the “Link to Financial Dimension” field, the system shows the “Dimensions” form.
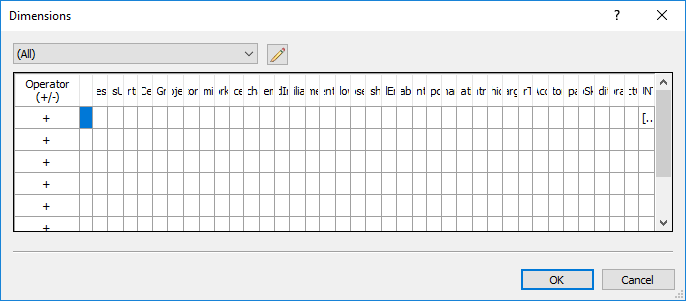
The form shows all financial dimensions defined in the system. Every dimension is presented in a specific column. You can find the financial dimensions by following “General ledger > Chart of accounts > Dimensions” in D365F. If there are a long list of defined financial dimensions, then the form becomes unreadable. You can define the dimension set and use it to only show the dimensions you need.
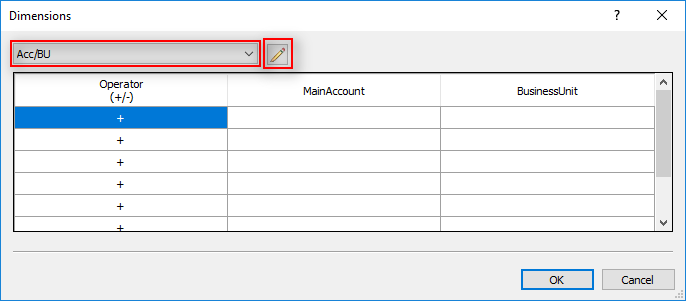
You can use the “pencil” icon to manage dimension sets.
The “Dimensions” form has lines where you need to specify the values of the account, account category, or financial dimension. Each line represents the combination of values which are used for querying transactions. You have an option to set up different combinations by using different lines in the form. The “Operate” filed indicates how the query results of the exact line will be processed. The sum and subtract options are available.
When you double-click on the dimension cell, the system shows the form for entering parameters.
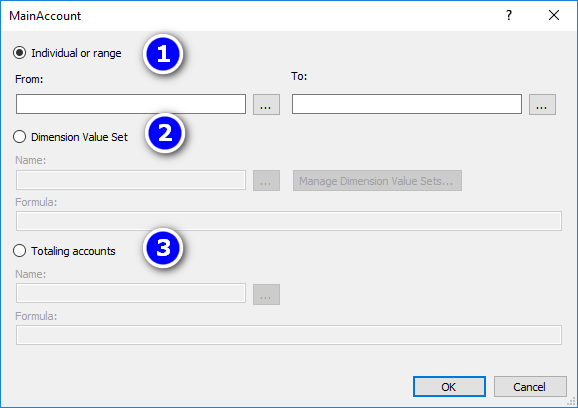
This form offers you three options to set up dimension values:
- You can set up a single value or a range of values of the exact dimension.
- Another option is to use a predefined dimension value set. To define the set, use the “Manage dimension Value Sets…” button. More about dimension value sets can be found here.
- You can also use the total ledger account or dimension value:
- Total accounts can be set up on the “Main accounts” page (General ledger > Chart of accounts > Accounts). The “Main account type” field in the “General” tab must be set as “Total” and account intervals should be specified in the form accessed by the “Totals” button.
- Total dimension values can be specified on the “Financial dimension values” page, which is accessible from the “Financial dimensions” page (General ledger > Chart of accounts > Dimensions) by the “Dimension values” button. The “Calculate total from multiple dimension values” checkbox must be set to “Yes” and the dimension value intervals must be specified by the “Totals” link.
The parameters you enter in the “Dimensions” form are transformed into a string which is entered into the “Link to Financial Dimensions” cell. You can edit the string directly in the cell. Alternatively, instead of using the forms described here, you can prepare the strings you need in Excel, and then copy and paste them to the row definition.
More about specifying the link to financial dimensions is here.
Column definition
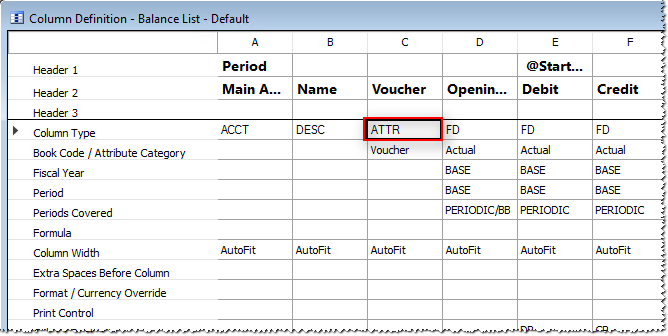
The filters related to the period and other attributes of a transaction are defined in the column definition.
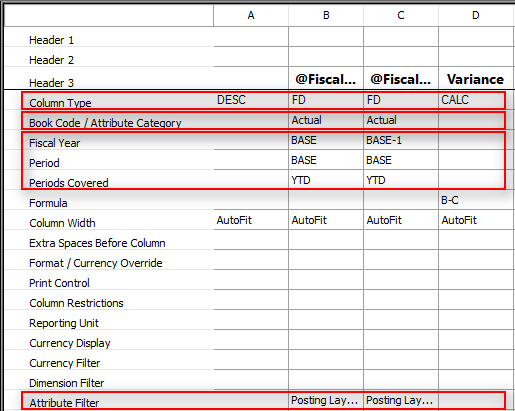
Let’s have a look at the parameters, which are marked in the image above.
Column type
The column type parameter defines which data will be shown in the column. It is required to set up the column where the row description will be shown. You need to use the DESC (description) column type. The row description is specified in the row definition form, as described in this section.
You also must set the FD column type. FD means that the column is used to fetch financial data. As we discussed above, the sources of financial data can be the ledger, cashflow forecast, or budgeting.
Documentation about column types is here.
Book code
The “Book code” column is used to specify exact financial data you need. To get data from the ledger, set up one of the following options in the “Book code / Attribute Category” cell:
- The “Actual – actual” option allows to query the amounts from the ledger transactions.
- The “ActualQuantity – Actual Quantity” option is for getting quantities from the ledger. The quantities can be input in the general journal line and posted to the ledger afterwards. The quantity is also available at least for transactions from the “Project module.”
You can find more about book codes in the documentation here.
Financial period
The concept of the financial periods in D365F is as follow:
Fiscal year
Every legal entity in the system has a link to the fiscal calendar. The fiscal calendar consists of fiscal years. It is necessary to specify how to define the fiscal year for the exact column of the report, so the financial reporting functionality can query data for the exact fiscal year.
The system declares a BASE variable at the reporting run time and uses it to store a base fiscal year. There are different options available to calculate a base fiscal year. The logic depends on the way the generation of the report was launched:
- If the report is generated from the report designer, then the year is based on the “Base year” field in the report definition form. The same is true when the report is generated from the report group.
- The report can also be generated from the D365F web interface. In this case the system uses the “Report date” field in the run parameters form. The year of that date is used as the base fiscal year.
- When the report is generated by the schedule, then the system uses the “Default base period” parameter in the report definition.
You need to set up the “Fiscal year” cell in the column definition form. You can set the fiscal year as BASE, meaning that the system uses the year that is defined at run time. You can also use an option to define the fiscal year as BASE+# or BASE-#. The hash sign (#) means the decimal which is used to specify the number of years that should be added or subtracted from the BASE year. You can also specify the fiscal year directly as a literal value. This option is not flexible because the fiscal year will be a constant.
The ability to set the fiscal year for the column allows you to implement reporting scenarios where you need to report on different years. For example, if you need to compare data for previous and current years, you can set the first year as BASE-1 and the second year as BASE.
The official documentation related to fiscal year setup is here.
Period
Every fiscal year has periods. To query the necessary period of the fiscal year, you need to specify which period to use for the column of the report.
Like the fiscal year, the system defines the BASE variable for the period at the reporting run time. The logic is similar to the logic for the fiscal year:
- If the report is generated from the report designer, then the “Base period” field is used in the report definition form. The same is true for generating from the report groups.
- When the report is generated from the D365F web interface, the system uses the “Report date” field in the run parameters form. The day and month are used to define a period.
- When the report is generated by schedule, then the system uses the “Default base period” parameter in the report definition.
The combination of the fiscal year and period parameters are used to define the exact year/period which must be used to calculate the amounts for all cells of the column.
For example, at report run time, the calculated year was 2020 and the period was 8. This means that our BASE fiscal year is 2020 and the BASE period is 8. Let us say that we also have two FD columns in the column definition:
| Column 1 | Column 2 | |
| Fiscal year | BASE-1 | BASE |
| Period | BASE | BASE |
Considering the example above, the system shows amounts for the year 2019 and period 8 in the column 1, and the amount for the year 2020 and the same period for the column 2. This approach allows to compare the same periods of different years.
You have the following option to define the period:
- Use the BASE period.
- Add or subtract from the BASE period (BASE+1; BASE-3, etc.).
- Set the range of periods (BASE:12, or 1:12, or BASE-3:BASE, etc.).
The documentation about periods is here.
Period covered
Collecting data for the exact year/period depends on the setting in the “Period covered” field. The system allows to get:
- Opening balance of the fiscal year.
- Opening balance of the period.
- Total sum of all activities of the period.
- Closing balance of the period.
To get the necessary information, you need to use one of the following options:
- YTD/BB allows to get the opening balance for the fiscal year.
- PERIODIC/BB is used to get the opening balance of the period.
- PERIODIC is for querying the total sum of all activities of the period. The system queries the transactions for the period and then sums up the amounts. The debit postings are considered as positive amounts and the credit postings as negative amounts. By summing the amounts, you will get the NET amount for the period. A positive result means that the opening balance of the period is debited and a negative result means that the opening balance is credited.
- YTD allows you to get the closing balance of the period.
The documentation about the “Period Covered” field is here.
Attribute filter
Another parameter that should be considered is the “Attribute filter.” When you query the general ledger, the parameter can be useful to filter transactions for the exact posting layer. If your general ledger setup presumes posting in different layers, then you probably do not want to mix the transactions from different layers.
More about attribute filters is described in this section.
Report definition
The report definition form includes all necessary parameters related to the exact report. Based on the parameters in the report definition, the system generates the report.
You need to create a report definition and specify at least the row and column definitions there. This form has many other parameters. Some of them are discussed in the sections below.
Generate the report
During the report development, it may be helpful to generate the report from the report designer. To do so, you need to set a base period and a base year in the report definition form and click on the “Generate” button. The report will be shown in the web browser when ready.
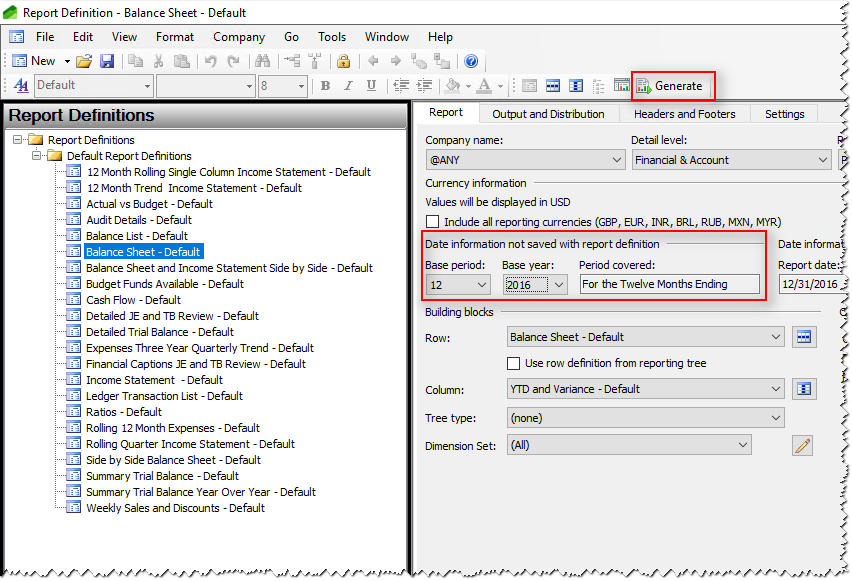
Other options to generate a report are here.
Other sources for reporting
In the sections below, we will see how to set up the report to get data from the cashflow forecast and budgeting.
Cashflow forecast
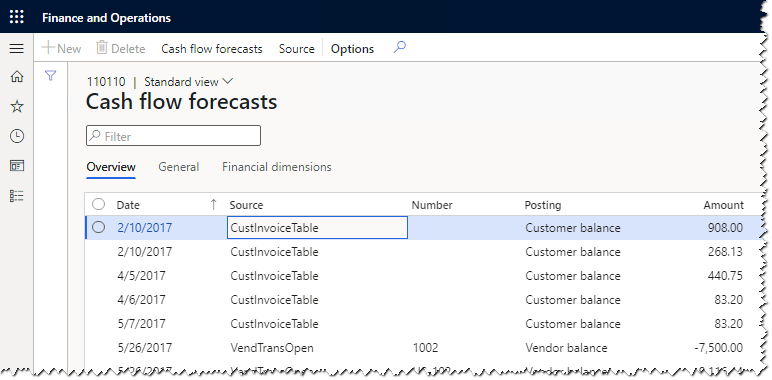
Financial reporting can be used to get data from the cashflow forecast. There are many aspects than may impact the forecast, including sales/purchase orders and invoices as well as inventory supply/demand forecast. The system forecasts the cash flow for the exact ledger account. You can open the forecast page by clicking the “Cash flow forecasts” button on the “Trial balance” page in D365F web interface.
To get data from the cash flow forecast in financial reporting, you need to use the “CashFlow – CashFlow Forecast” option in the “Book code / Attribute Category” cell in the column definition. All other parameters should be set up the same way as for querying the ledger.
More about cash flow forecasts functionality is here.
Budgeting
The “Budgeting” module can be a source of information for financial reporting. The system has an option where you can specify how to query the budget transactions. You can choose to query posted, posted and unposted, or only unposted budgets. The field for the setting is named as “Provisional” and available in the report definition.
You also need to set the book code parameter in the column definition depending on the data you need from the budgeting module. You can get data from the budget planning, budget register, or budget control.
More about budgeting in D365F is here.
Budget planning
The financial reporting allows to query budget planning transactions for different scenarios. The source documents which are used to collect this information are on the D365F page “Budget plans” (Budgeting). You can also find the budget planning information on the page “Budget plan lines” (Budgeting > Inquiries and reports > Budget planning).
The list in the “Book code / Attribute category” cell in the column definition depends on the available scenarios in the system. The items in the list for the budget planning follow this pattern:
- <scenario> – <scenario>
- <scenario> BudgetPlanPrice – <scenario> Price
- <scenario> BudgetPlanQuantity – <scenario> Quantity
To get the appropriate information regarding budget plans, you also need to define an attribute filter for the exact “Budget planning stage.” If you do not filter by the stage, you will get a sum of amounts from different planning stages.
Budget register
The financial reporting allows querying of data from the budget register entries for different budget models. The source documents are available on the page “Budget register entry” (Budgeting > Budget register entry). The information from the documents is accessible on the page “Budget account entries” (Budgeting > Inquiries and reports > Basic budgeting).
The items in the list of the “Book code / Attribute category” cell in the column definition follow the pattern:
- <budget model> – Fiscal year budget
- <budget model>BudgetPrice – Fiscal year budget Price
- <budget model>BudgetQuantity – Fiscal year budget Quantity
More about budget register entries is here.
Budget control
You have an option to query budget control amounts in the financial reporting. Similar data is available in the “Budget control account detail history report” (Budgeting > Inquiries and reports > Budget control).
The options of the “Book code / Attribute Category” list in the column definition follow the pattern:
- <budget model>BudgetControl – <budget model> Budget Control
When you work with the budget control records, you should consider that the system queries transactions for different control categories. To calculate an actual budget balance, you need to subtract the confirmed actual expenditures from original budget amounts. To achieve this, you can configure two columns: the first one for budgeted amounts, and the second for consumed amounts. To filter the necessary amounts, you can utilize the “Attribute filter” option. The subtraction can be set up in the additional column by using the “CALC” column type.
Drill-down functionality
The financial reporting allows you to “drill down”. This means that you can access successively deeper levels of hierarchically-organized reports.
The drill down has three levels: financial, account, and transaction. On the financial level the system shows the rows, defined in the row definition. The account level shows aggregated data by dimensions. On the transaction level, the report shows the transactions that were used to calculate the result.
There are options available regarding the account (second) and transactions (third) drill-down levels. The details are in the sections below.
The documentation about drill down is here.
Detail-level setup for the report
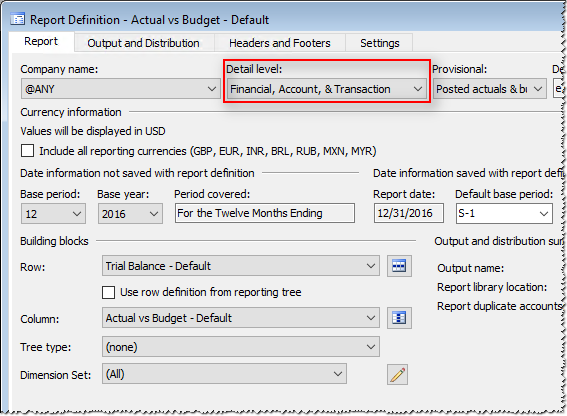
To activate the drill-down, you need to set up the “Detail level” parameter in the report definition. To be able to access to all three levels, you need to specify the “Financial, Account, & Transaction” option.
Grouping on the account level
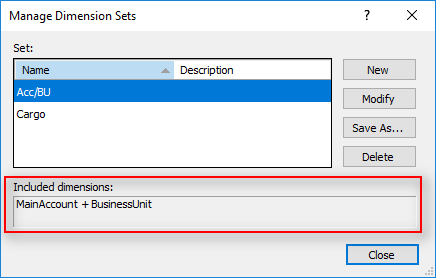
You have an option to specify the dimensions which must be used to group the amounts on the account (second) level of the drill-down. By default, the system groups the amount by all dimensions which were used to calculate the amount for the report row. However, you can define the dimension set which is mentioned in this section; after that, you need to specify this set in the “Dimension set” field in the report definition.
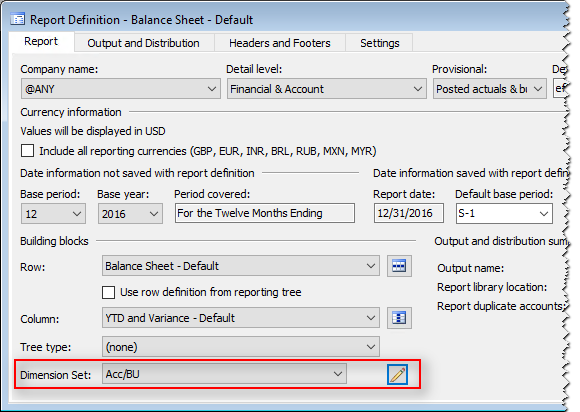
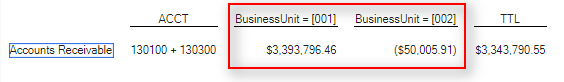
Here is an example. Let say you need to get the sums of amounts grouped by main account and business unit. Then you need to set up the dimension set as shown in the image below.
As a result, you will get the account level drill-down grouped by two dimensions.
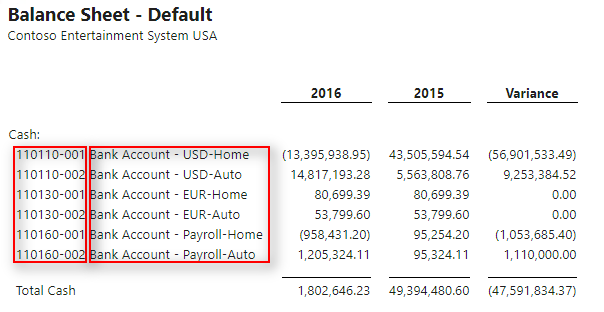
The first red frame in the image above shows the account and business unit codes. The second frame shows account and business unit descriptions.
Transaction level options
Basically, there are three layouts available in the system which are used to show the transactions level. The layouts are:
- Transactions level report
- Account transactions page
- Budget account entries page
All these options are shown in the image below.
You may also not have the option to drill down to the transactions level. This level is not available under the following circumstances: when querying the cash flow forecast, budget planning, or budget control and the report does not have the “PERIODIC” column.
Transactions level report
The system drills down to the transactions level report only under the following conditions: querying the ledger, cash flow, budget planning, budget register, or budget control, and the “PERIODIC” column is available in the report.
When you click on the dimension values in the account drill-down report, the system shows the transactions level report. If you click on the amount from the ledger or budget register sources, the context menu will be shown.
Account transactions page
The system opens the account transactions page when querying the ledger and the report does NOT have the “PERIODIC” column. In this case you have an option to click on the amount and the system shows the account transactions page.
Budget account entries page
The budget account entries page is accessible under the following circumstances: querying the budget register and the report does NOT have the “PERIODIC” column. You can click on the amount and the system shows the budget account entries page. The same form is accessible by the menu item “Budget account entries” (Budgeting > Inquiries and reports > Basic budgeting).
Context menu
The financial reporting may also show a context menu with the items: “Drill to report transaction level”, “Open account transactions”, and “Open budget account entries.” This menu appears under the following circumstances:
- You query the ledger and the report has the “PERIODIC” periods covered column. When you click on the amount, the system shows the context menu where the “Drill to report transaction level” and “Open account transactions” are enabled.
- Querying the budget register and the report has the “PERIODIC” column. Clicking on the amount opens the context menu with the enabled items “Drill to report transaction level” and “Open budget account entries.”
Override a column definition
In some cases, you may need to adjust the data querying parameters for the exact row (override column definition settings). A typical example is the cash flow statement. This statement reports the changes on accounts for the given period: operating income, depreciation, accounts payable/receivable, etc. At the same time, you usually need to show the balances for the cash accounts for the given date. These amounts usually should be shown in the column where the activity amounts are placed.
As is shown in the example below, to calculate the net cash flow from operations and investing/financing activities, you need to use the “PERIODIC” value in the “Periods covered” parameter of the column definition. However, to calculate the cash position, you need the “PERIODIC/BB” and “YTD” options for the same column.
| Dec 2020 | |
| Operation income | 1000 |
| Depreciation Expense | 200 |
| Increase in Accounts Receivable | -300 |
| Decrease in Accounts Payable | -300 |
| Net Cash Flow from operations | 600 |
| Net Cash Flow from investing/financing activities | 0 |
| === Cash position === | |
| Opening Cash Balance (actual) | 2500 |
| Closing Cash Balance (actual) | 3100 |
| Differences between calculated and actual | 0 |
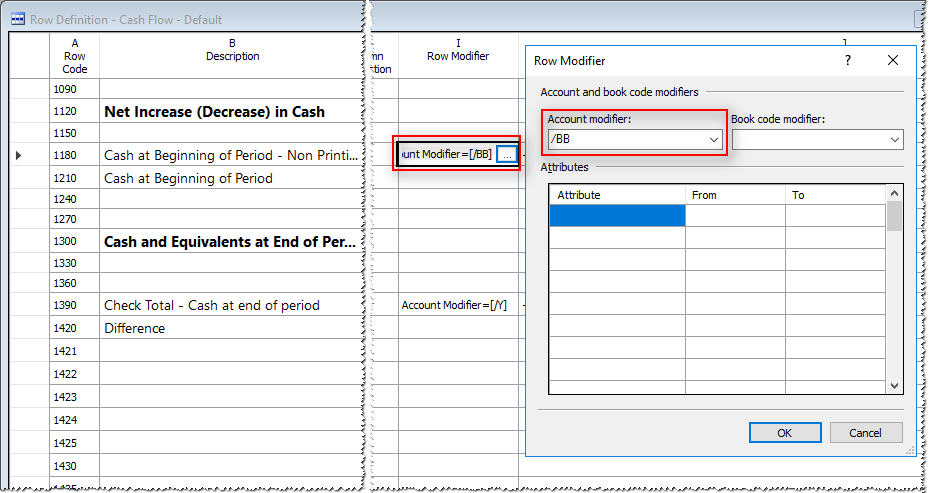
To get the cash position you need to use the account modifiers.
Account modifier
You have the option to override the following column definition parameters: fiscal year, period, and periods covered. To set up the period parameters for the exact rows, you can use an account modifier. This parameter is available through the “Row modifier” cell in the row definition.
The system has four base account modifiers. The modifier works in conjunction with the fiscal year, period, and periods covered settings in the column definition.
The table below lists the output you get, depending on the settings in the account modifier and periods covered parameters.
| Acc.mod. \ per.cov. | PERIODIC | PERIODIC/BB | YTD | YTD/BB |
| /BB | YP/OB | YP/OB | (YP)1/OB | (YP)1/OB |
| /# | Y#/PR | Y#/OB | Y#/CB | Y1/OB |
| /-# | YP-#/PR | YP-#/OB | YP-#/CB | (YP-#)1/OB |
| /+# | YP+#/PR | YP+#/OB | YP+#/CB | (YP+#)1/OB |
| /C | YP/PR | YP-1/PR | YP/PR | YP/PR |
| /C-# | YP-#/PR | YP-#/OB | YP-#/OB | YP-#/OB |
| /C+# | YP+#/PR | YP+#/OB | YP+#/OB | YP+#/OB |
| /Y | YP/CB | (YP)1/OB | YP/CB | (YP)1/OB |
| /Y-# | YP-#/CB | (YP-#)1/OB | YP-#/CB | (YP-#)1/OB |
| /Y+# | YP+#/CB | (YP+#)1/OB | YP+#/CB | (YP+#)1/OB |
To describe the output, I used the following syntax: FYaP/Result.
The FYaP stands for the “Fiscal year and period”. This is the year/period which is used for calculating of the result. The variations are:
- YP – the system defines the year/period based on the settings in the column definition. Please consider that if you subtract the periods in the “Period” cell of the column definition (like “BASE-1”), the year can be changed. For example, the calculated BASE year/period for the report is 2021/01. The “Period” cell is set as “BASE-1”, then the system uses the 2020/12 year/period for the column.
- (YP)1 – the first period of year, which is defined for year/period in the column definition.
- Y# – the # means the literal period of the defined in the column definition year.
- YP-# – first, the system defines the year/period based on the settings in the column definition, and then subtracts the number of periods specified in the account modifier. Please consider that when you subtract the periods, the year can be changed. For example, the defined year/period is 2021/01 and you subtract 3 periods, then the system uses the 2020/10 year/period for calculating.
- (YP-#)1 – means that the first period of the year is used, which is defined as for the YP-#.
- YP+# – the same as YP-#, except the addition of periods is used.
- (YP+#)1 – means that the first period of the year is used, which is defined as for the YP+#.
- YP-1 – the year/period defined as for the YP minus one period.
The possible results are:
- OB – opening balance of the period.
- PR – periodic activities (debit minus credit amounts for the period).
- CB – closing balance of the period.
Examples:
- Let us say that the modifier for the row is set as “/BB” and the periods covered is set as “PERIODIC” in the column definition, then the system returns the “YP/OB”. It means the system uses the “fiscal year” and “period” parameters (YP) in the column definition and returns the opening balance (OB) of the period.
- If the modifier is “/Y” and the period covered is “PERIODIC/BB”, then the system calculates the “(YP)1/OB”, meaning the opening balance (OB) of the first period of the fiscal year ((YP)1). The year is calculated based on the year/period which is defined in accordance with the settings in the “Fiscal year” and “Period” parameters in the column definition.
- If the modifier is “/C+1” and the periods covered is “YTD”, then the system returns the “YP+1/OB”. The system takes the next period based on the year/period calculated for the column, and then returns the opening balance.
More info about account modifiers is here.
Book code modifier
Financial reporting functionality allows to specify a book code for the row. This setting overrides the book code specified in the column definition. To override the book code, you need to use the “Row modifier” field in the row definition.
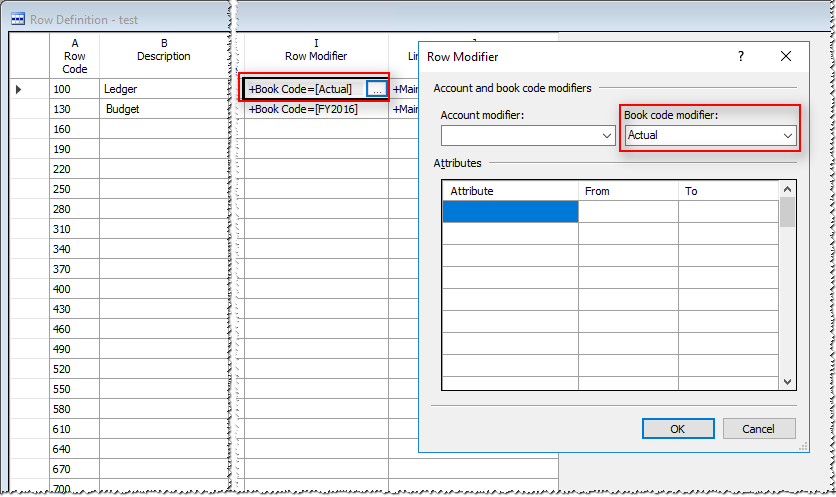
In the example above, the amount is from the ledger for the first row, and is from the budgeting for the second row.
Other options to query and filter
This section is about different options you have to pull financial data in the report.
Debit/credit transactions
You have options to get only debit or credit amounts in financial reporting, so you can configure a kind of a trial balance report.
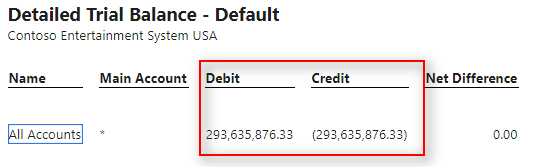
These options are available in the “Column restrictions” cell in the column definition.
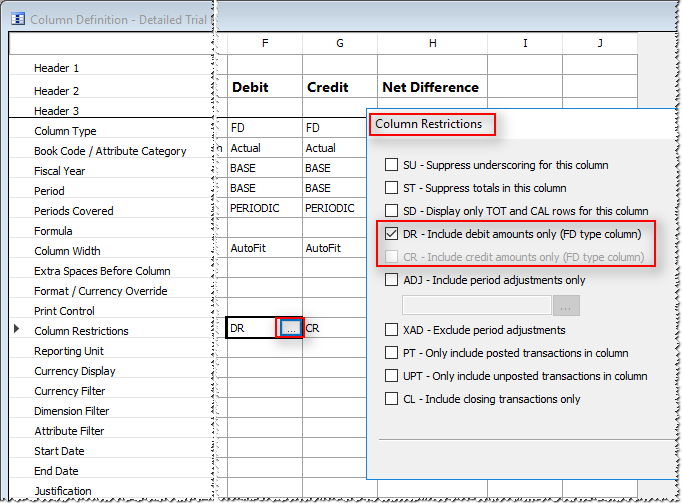
- DR – if set, this restriction allows you to only get the total of debit transactions.
- CR – this restriction allows you to only get the total of credit transactions.
More about column restrictions is here.
Filtering by accounts/dimensions
You have an option to filter by dimension values in the exact column of the report. For example, you can query all transactions of the exact ledger accounts for the whole row, and specify exact business units for the columns.
This option is available in the column definition form. The “Dimension Filter” cell is used to specify the filter.
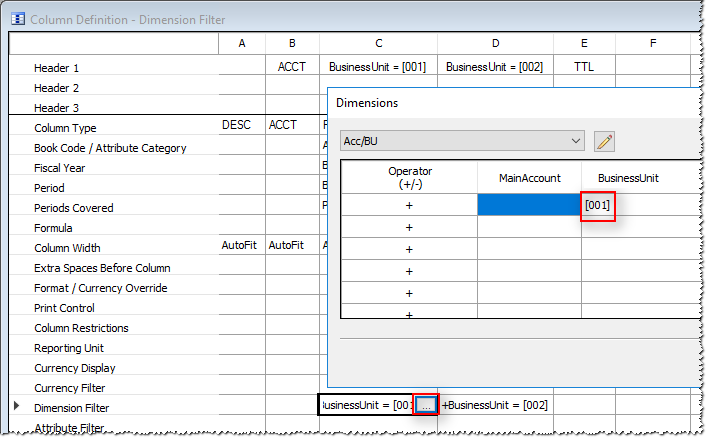
The documentation about filtering by dimension is here.
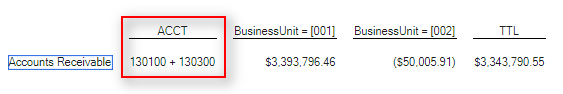
Displaying ledger accounts
To show ledger accounts which were used to get records, you can use the ACCT column type in the column definition. The example of the report is shown below.
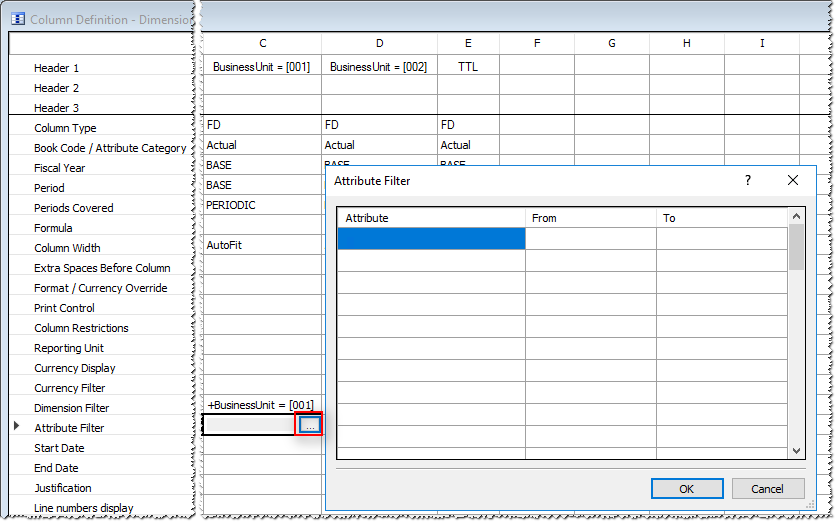
Filtering by attributes
Financial reporting allows to specify attribute filters in the column and row definitions. To specify the filter for the column, you need to use the “Attribute Filter” cell in the column definition. The filter is applied to the all cells of the column in the report.
When you set the filter for the row, the filter is applied to all cells of the row. The option is available in the “Row Modifier” form in the row definition.
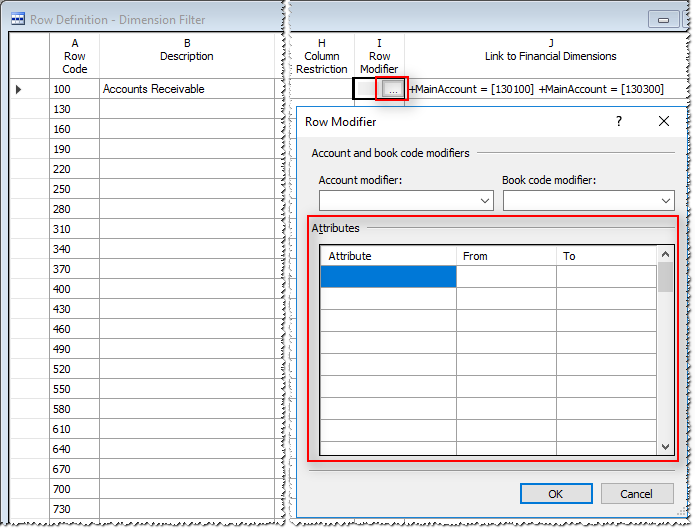
The cell of the report where the attribute filters are defined in the intersected row and column is affected by all row and column definitions filter attributes.
The documentation is here.
Displaying attributes
The system allows to show attributes of the transaction. The attributes might be vouchers, posting layers, and so on. In the image below is shown the “Voucher” attribute of the transaction.
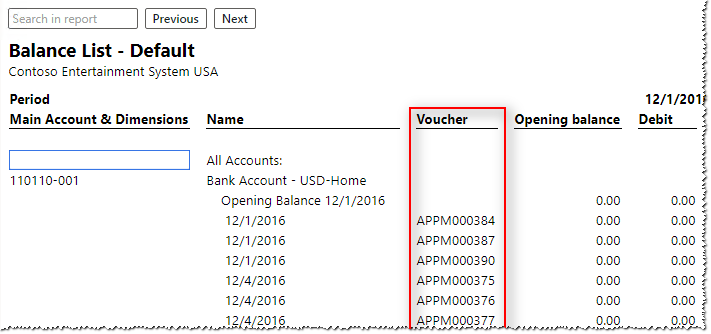
The attribute column is only shown on the transaction level of the report.
You need to set up the ATTR column type in the column definition.
Filtering period by dates
Financial reporting allows to query amounts for the period by specifying the financial period. It is also possible to override this behavior by specifying dates in the “Start Date” and “End Date” in the column definition form. These cells can be used only when the “Periods covered” cell is set to “PERIODIC.”
Specifying the “Start Date” and “End Date” parameters overrides the period defined in the “Fiscal Year” and “Period” fields. You can only define the exact dates in these cells, meaning that you set the constants. I suppose it can be useful when you need a constant basis for comparing in your report.
The documentation is here.
Closing period adjustments
The system allows to make closing period adjustments. The functionality is available in the “Closing period adjustments” (General ledger > Period close) menu item in D365F. By default, the financial reporting includes the adjustments in calculations, but you have an option to exclude them. The option is named as “XAD – Exclude period adjustments” and available in in the “Column restriction” cell in the column definition.
You also have an option to only get the adjustments. The setting is “ADJ – Include period adjustments only.”
The trial balance (General ledger > Inquiries and reports > Trial balance) has an option regarding adjustments as well. The option is under the button “Columns to display” on the “Trial balance” page, and named “Include closing period adjustments in balances.”
The closing adjustment amounts are also available on the “Period balances” page, which is accessible by the “Period” button on the trial balance page.
More about column restrictions is here.
Closing transactions
D365F has functionality to create closing transactions while the year-end close has been processed. The option is available in the “General ledger parameters” (General ledger > Ledger setup) menu, named “Create closing transactions during transfer.”
You can use the “CL – Include closing transactions only” column restriction in the column definition to get closing transaction amounts in financial reporting. Keep in mind that the “CL” option does not include transaction adjustments which can be posted by the “Closing period adjustments” (General ledger > Period close) menu item.
You can get the closing transaction amounts from the trial balance (General ledger > Inquiries and reports > Trial balance) as well. The option is available under the button “Columns to display” on the “Trial balance” page, named “Include closing transactions in balances.”
You also can find closing transactions in the “Close-of-year transactions report” (General ledger > Inquiries and reports > Period end reports) and “Dimension statement” (General ledger > Inquiries and reports > Ledger reports) reports in D365F.
Documentation about closing of the year parameters is here. More about column restrictions is here.
Posted/unposted transactions
Financial reporting allows to query posted ledger transactions, posted and unposted budget transactions. The “Provisional” setting in the report definition form is used to specify the needed transactions. The additional options in the “Column restriction” of the column definition are available and give more flexibility to query posted or unposted transactions. The options are:
- PT – Only include posted transactions in column.
- UPT – Only include unposted transactions in column.
More about column restrictions is here.
Options to generate reports
The system provides a few options to generate a report. The basic option which is suitable for report development is to generate report from the report designer. Other available options are described in this section.
Generating from the WEB interface
The most direct option to generate a report is to use the “Financial reports” (General ledger > Inquiries and reports) page in D365F. To generate the report, choose the needed line in the left pane and click the “Generated” button. Then specify the date which is used to calculate a base fiscal year and a period and click “OK.” After that, the system will generate the report.
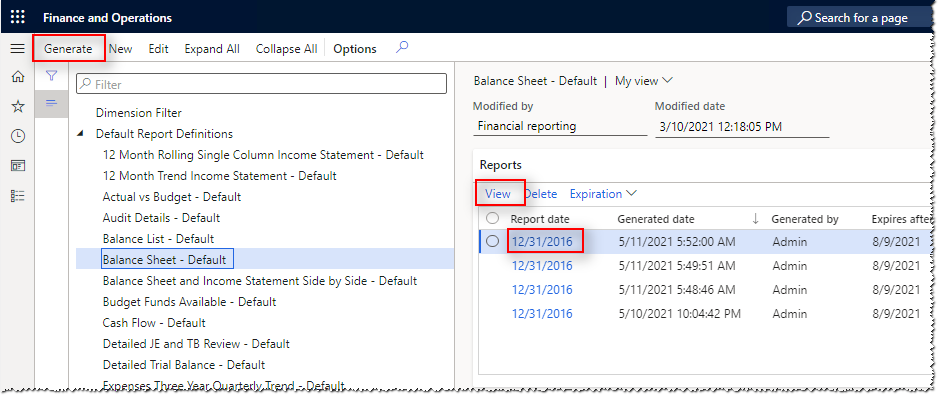
To make the report display on the “Reports” tab, you need to refresh the page. To open the report, click on the “View” button or on the report date.
Generate a group of reports
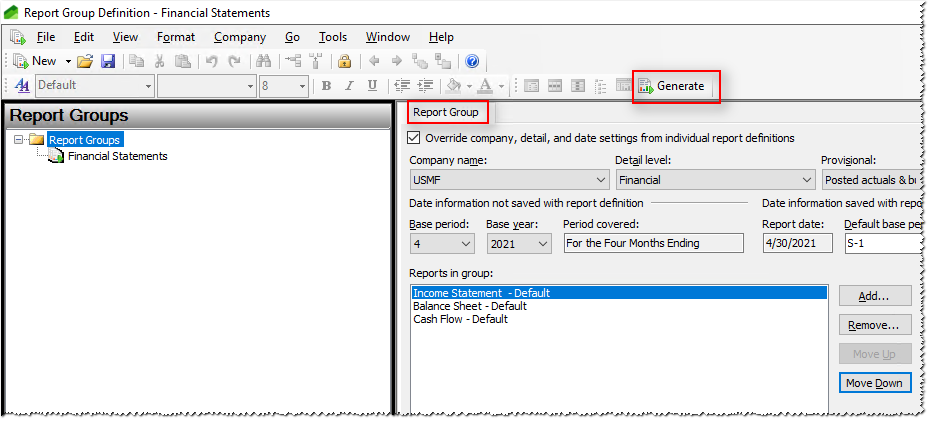
We have already covered how to generate the report from the designer. Similarly, it is also possible to generate a group of reports. To set up a group of reports, use the “Report groups” form in the report designer. This form allows you to set up the parameters which will be overwritten for the individual reports in the group.
To generate a group of reports, you need just to choose the group of the reports and click on the “Generate” button.
However, this time the reports will not be shown automatically in the browser when they are ready. You need to open the reports individually.
Generating by schedule
The system provides an option to generate the financial reports on a schedule. The schedule should be defined in the “Report Schedule” form in the report designer. There is an option to set up the schedule for a report group or for an individual report.
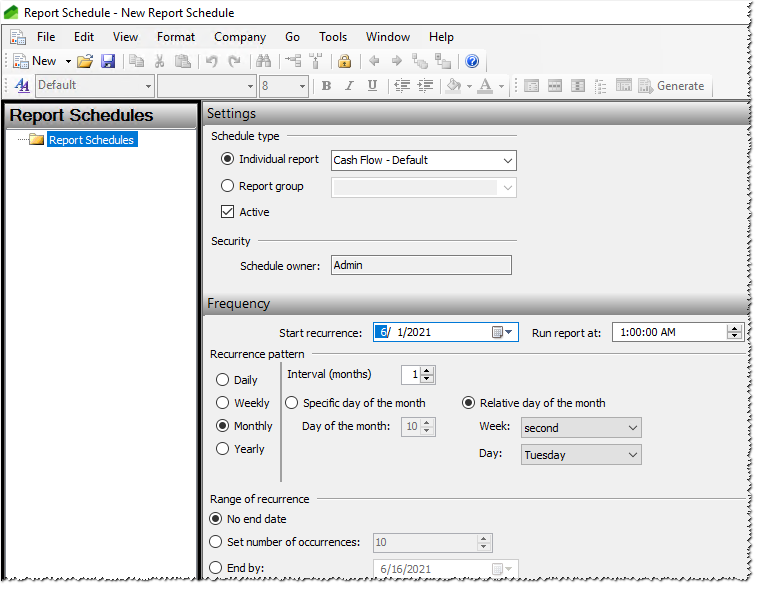
The image above shows an example for generating the cash flow report on every second Tuesday of the month.
The documentation about scheduling is here.
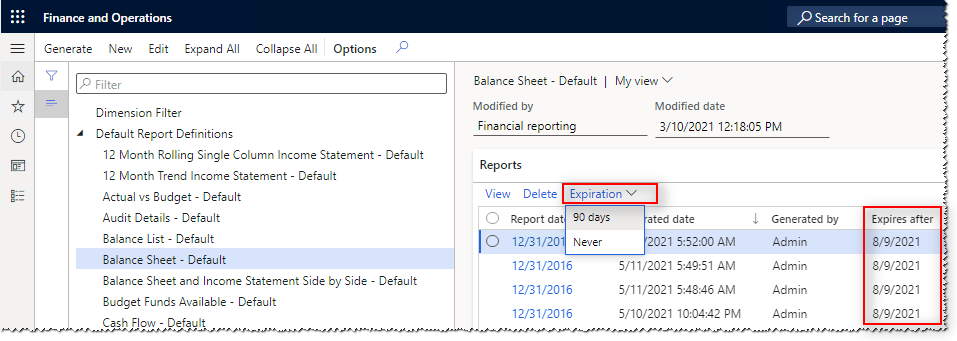
Retention of the reports
The system allows you to manage which reports are temporary and must be automatically deleted after a certain date, and which must be deleted manually. You can manage retention of reports on the “Financial reports” page.
The documentation is here.
Conclusion
This article provides many options to query transactions by utilizing the financial reporting functionality in D365F. However, the financial reporting system has many more options than I have described here. For example, it also allows you to use formulas, work with different currencies, build hierarchies, etc. Please feel free to share your thoughts in comments about the functionality you are interested in. I’ll be happy to consider your valuable input in the future posts.
Thanks for reading and for your interest in Dynamics 365 Finance!
